Maths
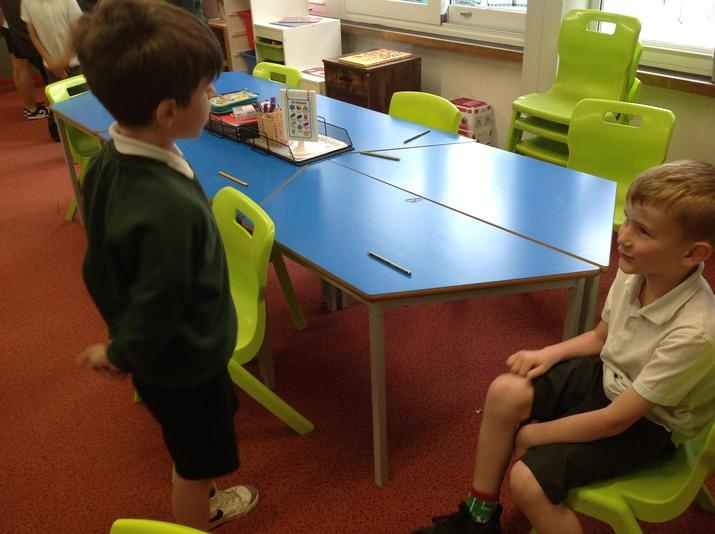
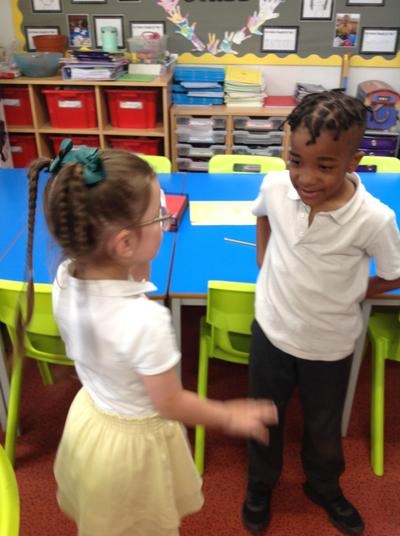
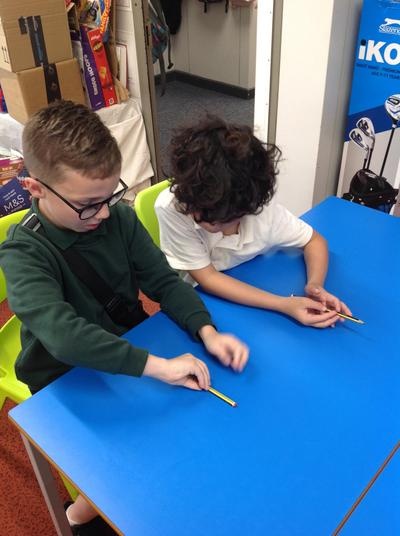
Our topic for the next few weeks is statistics and we have been studying tables, tally charts and block diagrams this week. We have discussed the features of each one and the advantages of using them, also thinking about when each one would not be appropriate. We have used tables, tally charts and block diagrams to interpret data and identify the answers to both sum and difference questions.
This week, we continue to collect and interpret data and have also been drawing our own pictograms. We have learnt more about what pictograms are and have been focusing on when each picture represents one. We have been answering questions about the pictograms and interpreting the data, being able to identify most or least popular items and calculating the difference using terms such as 'how many more'. We have also collected our own data using tally charts and then have used this information to present our own pictograms.
